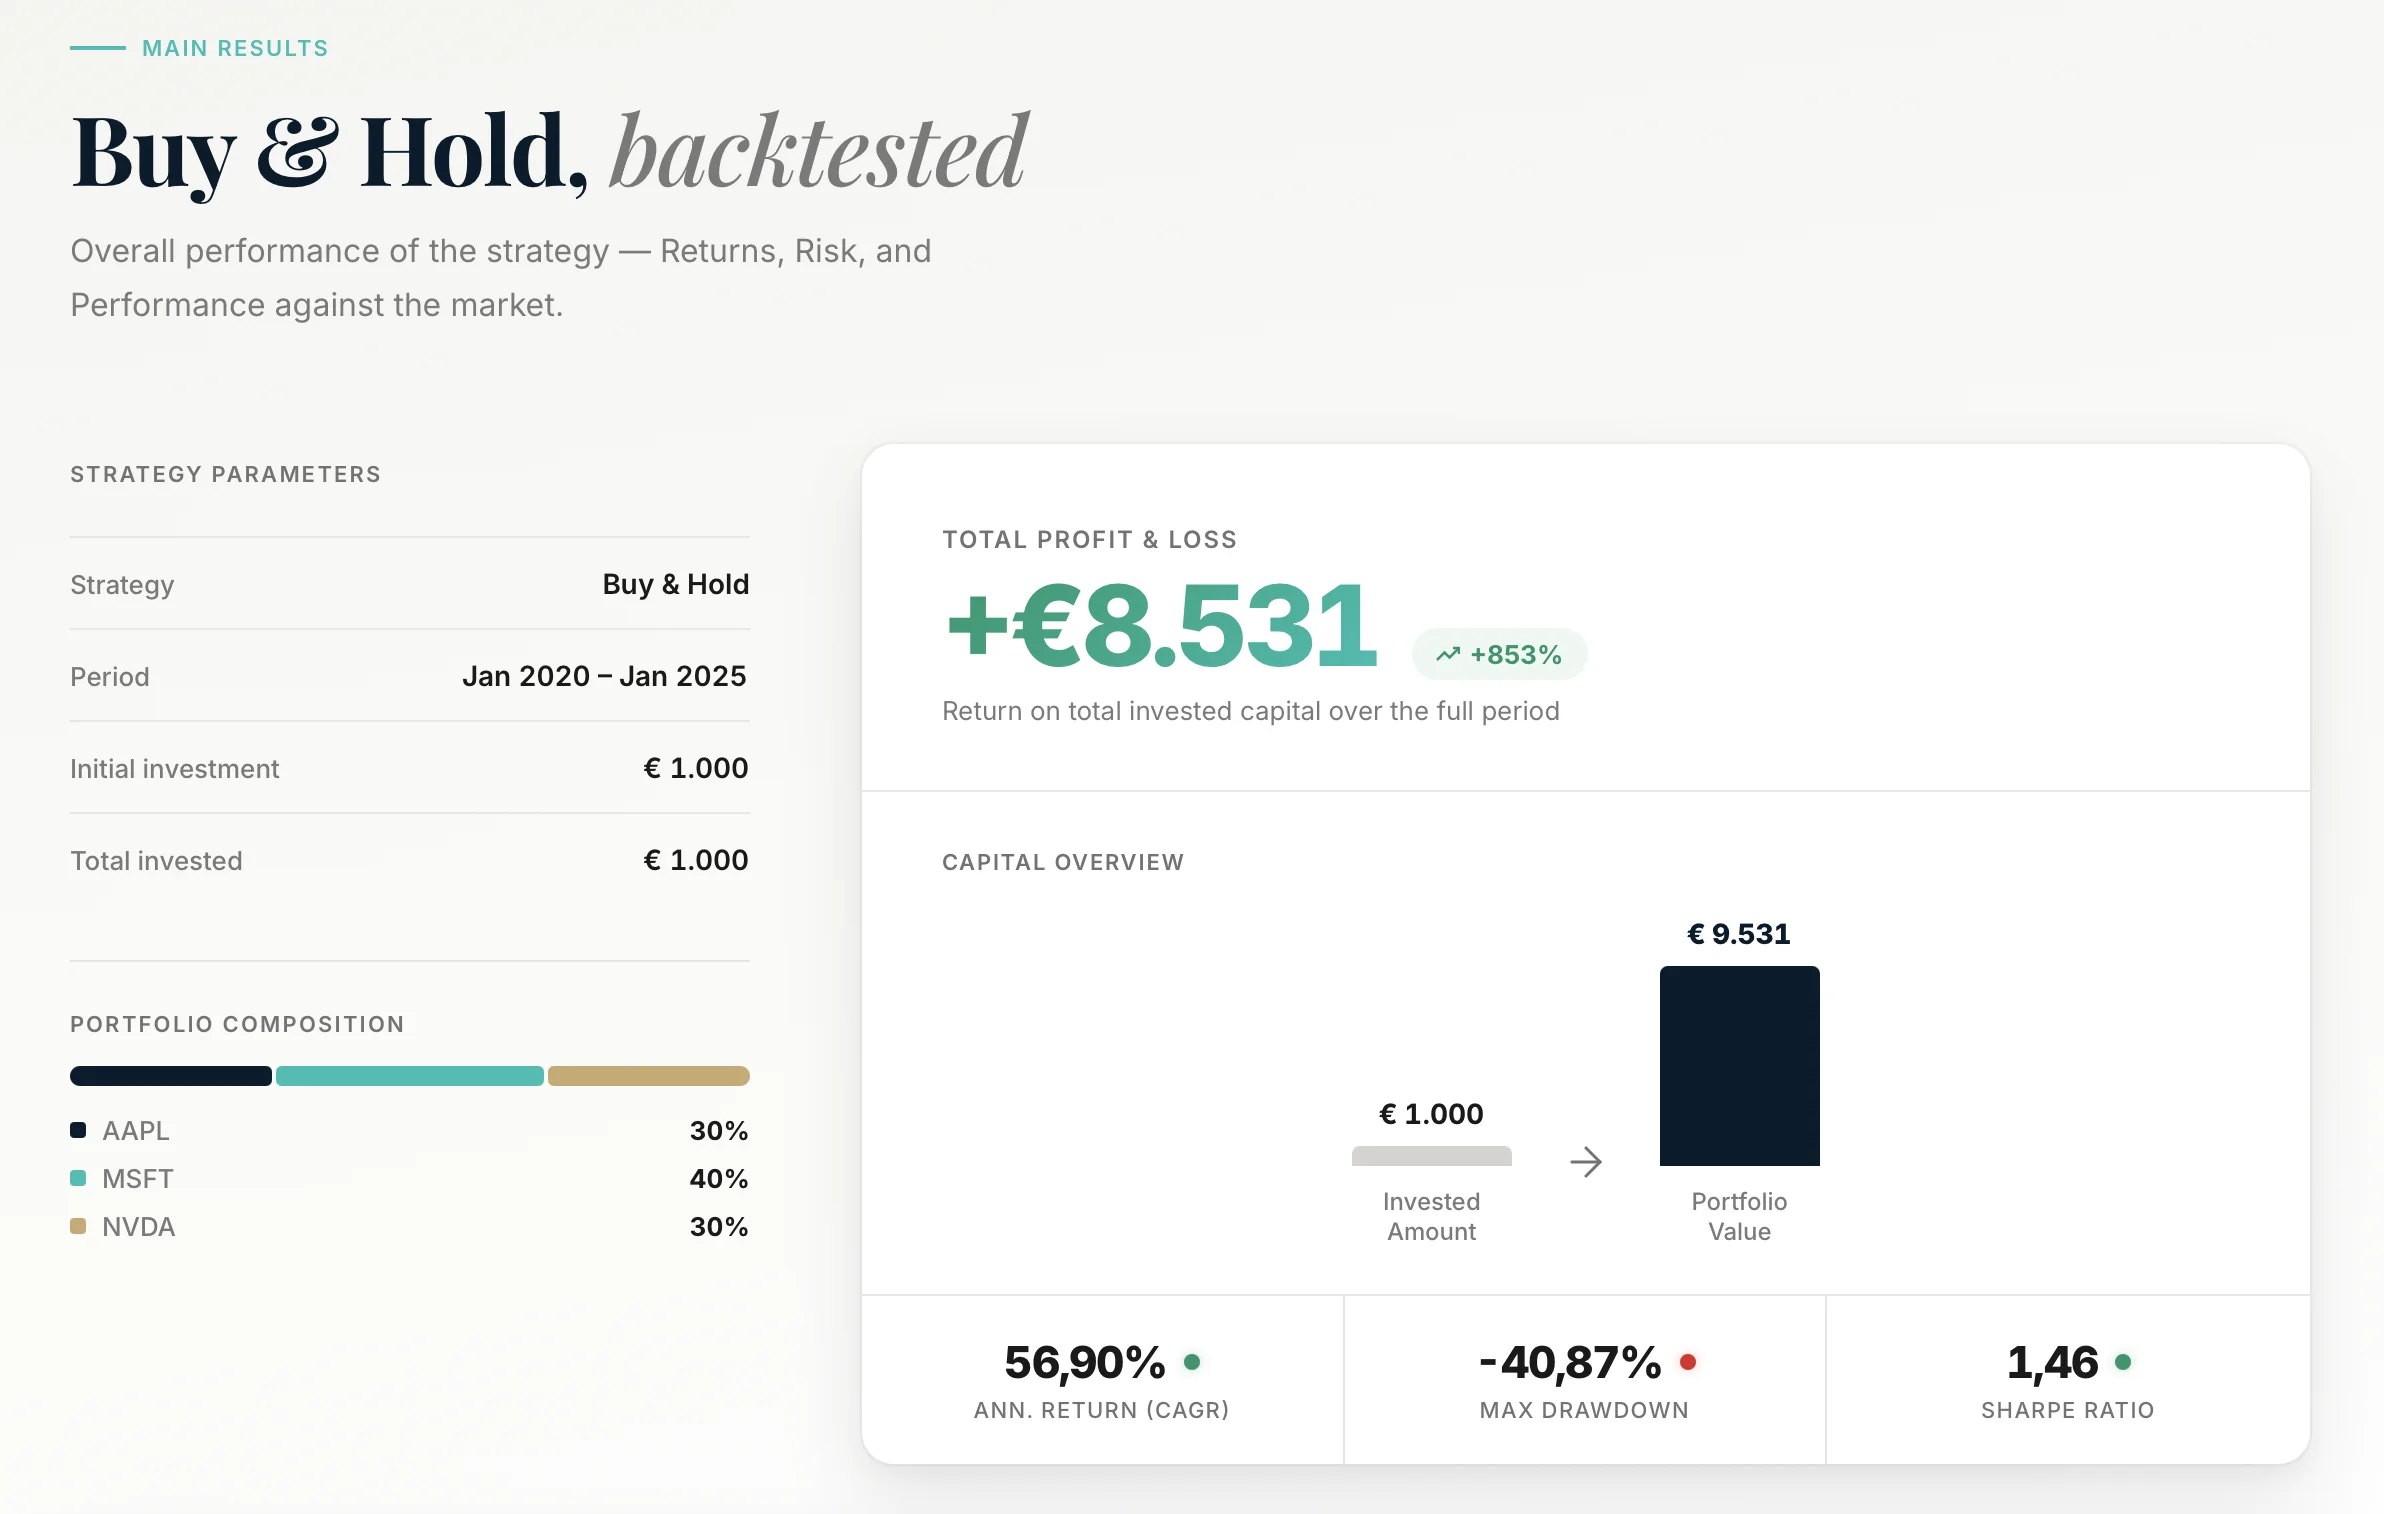
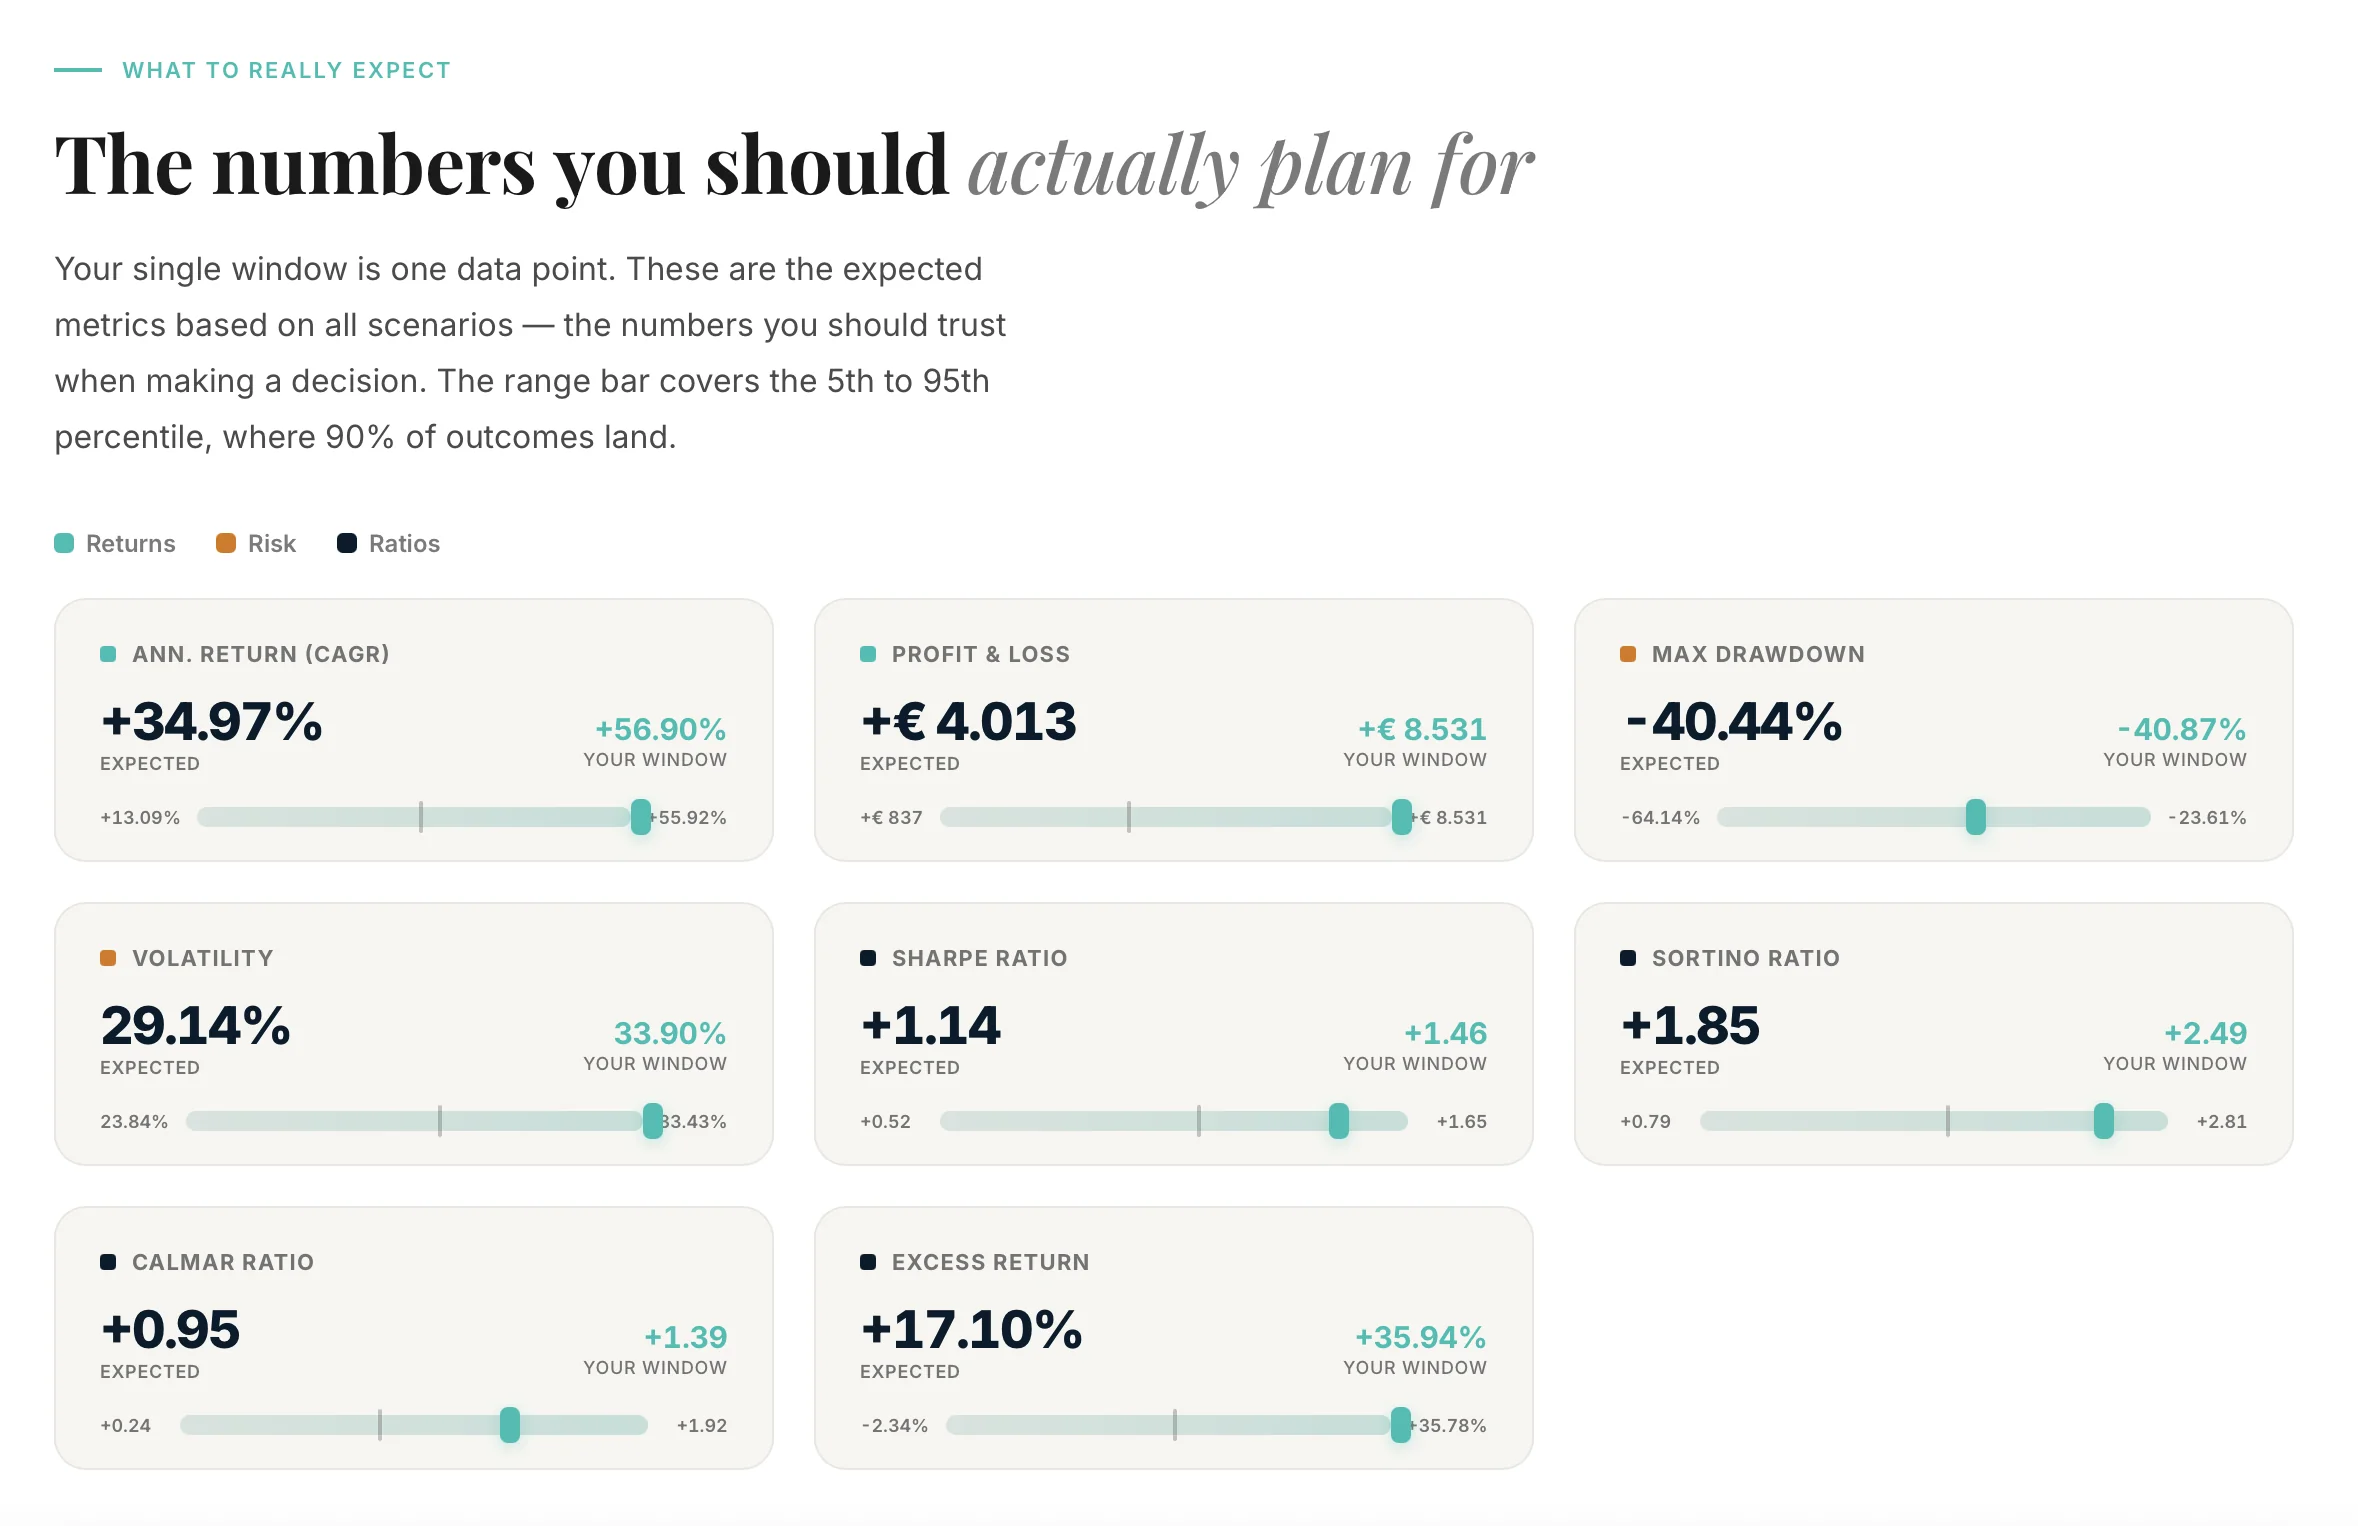
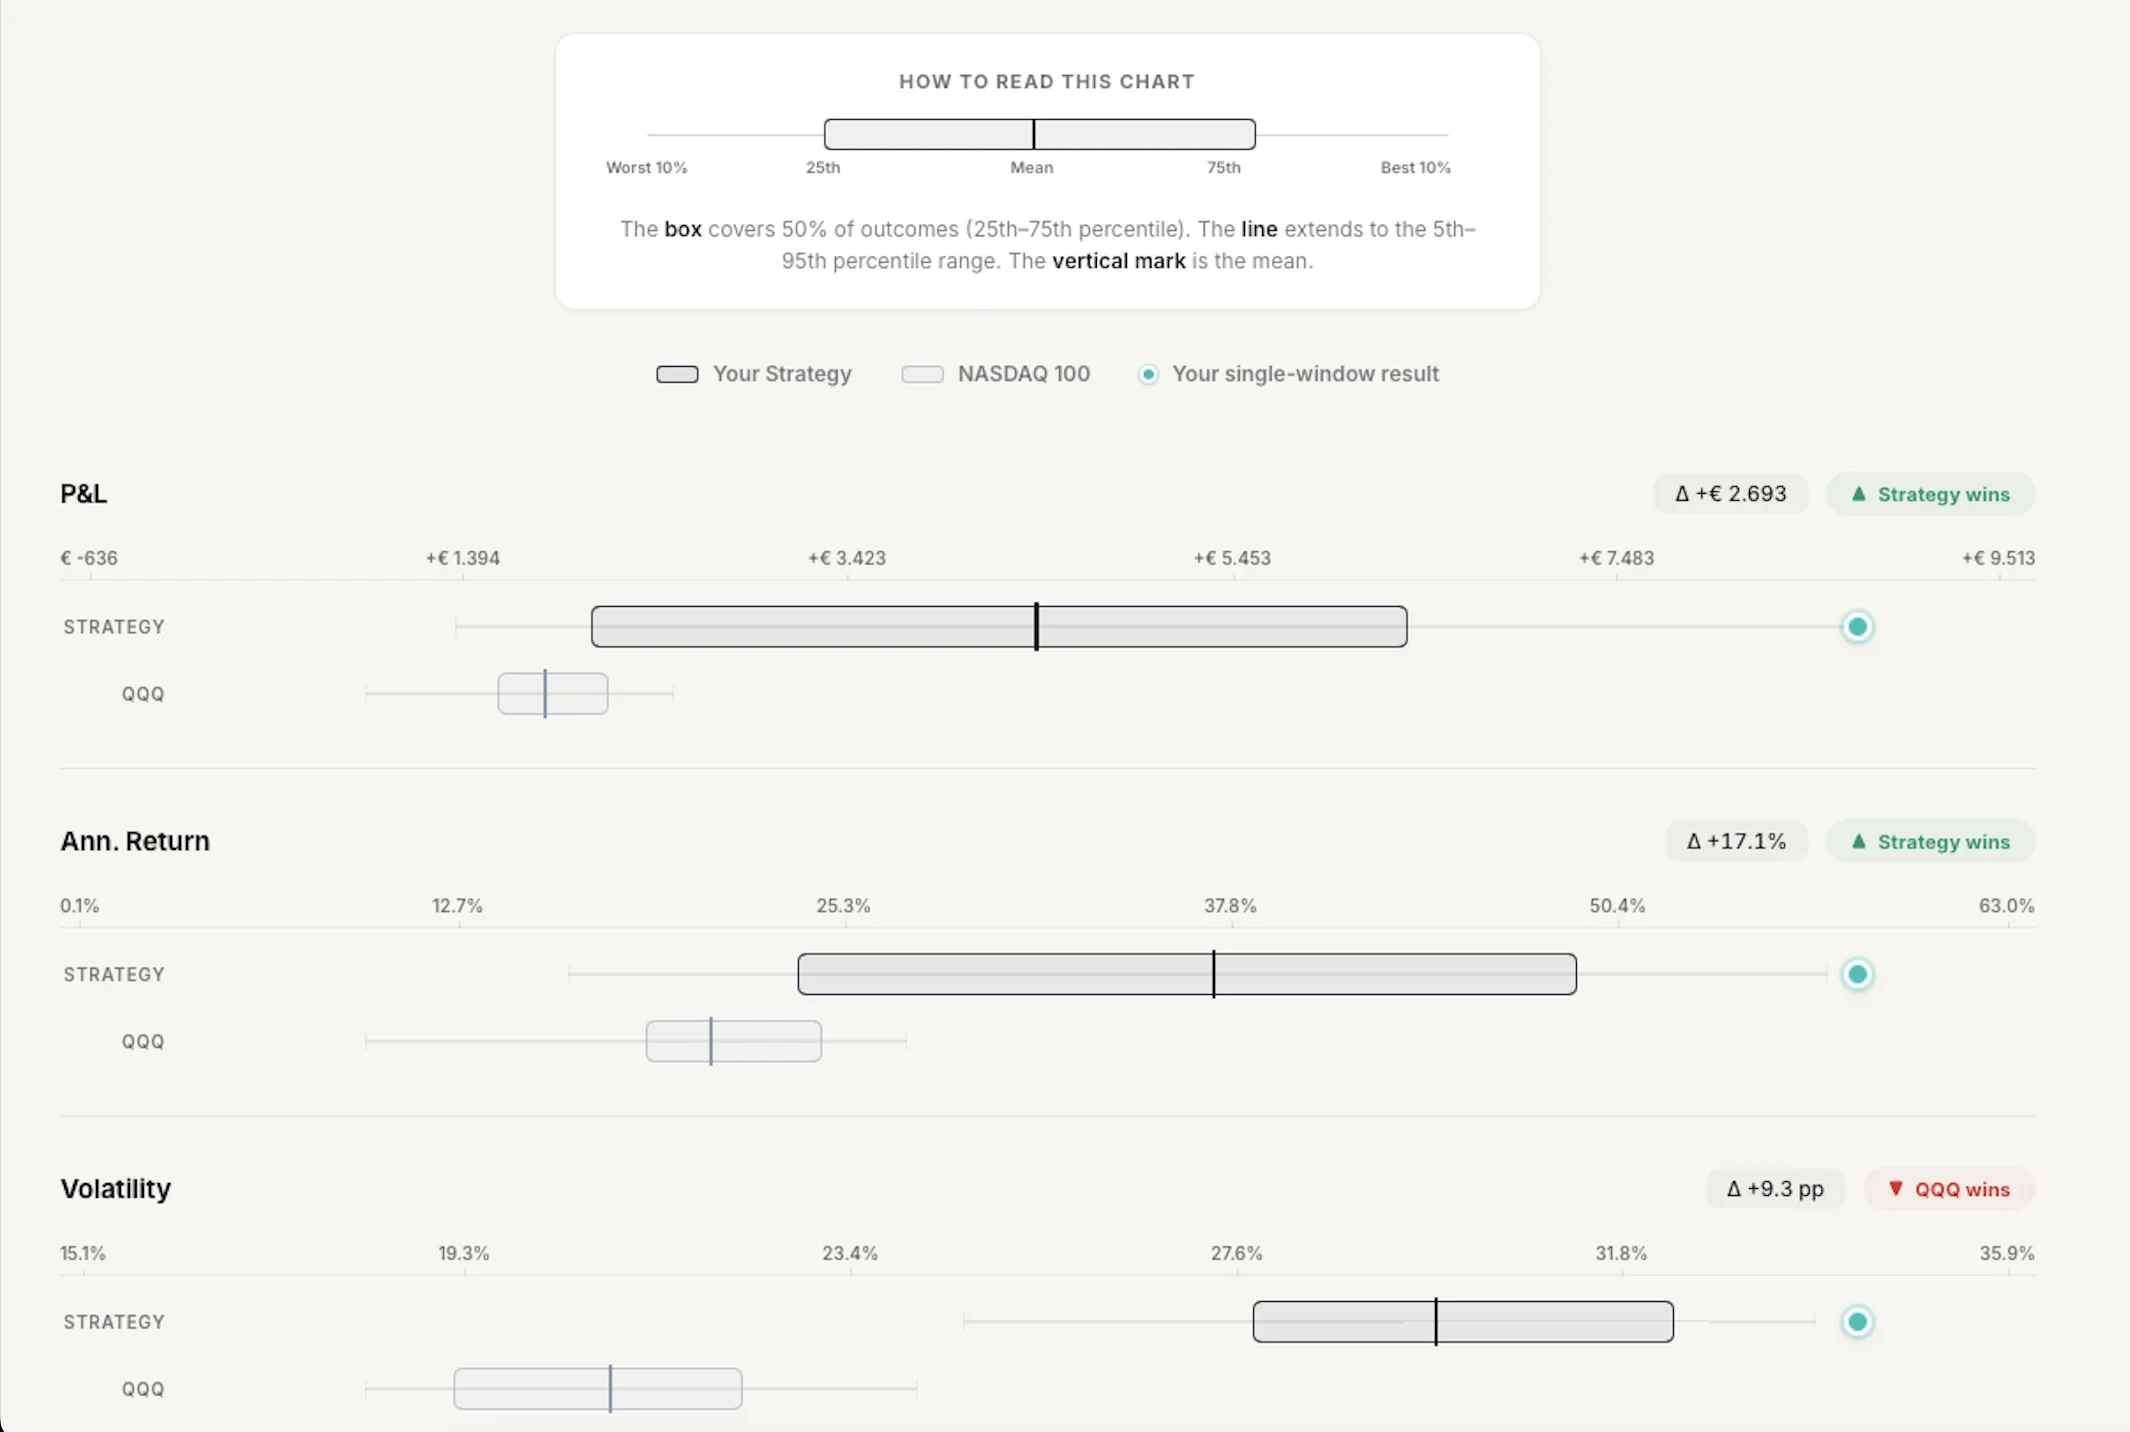
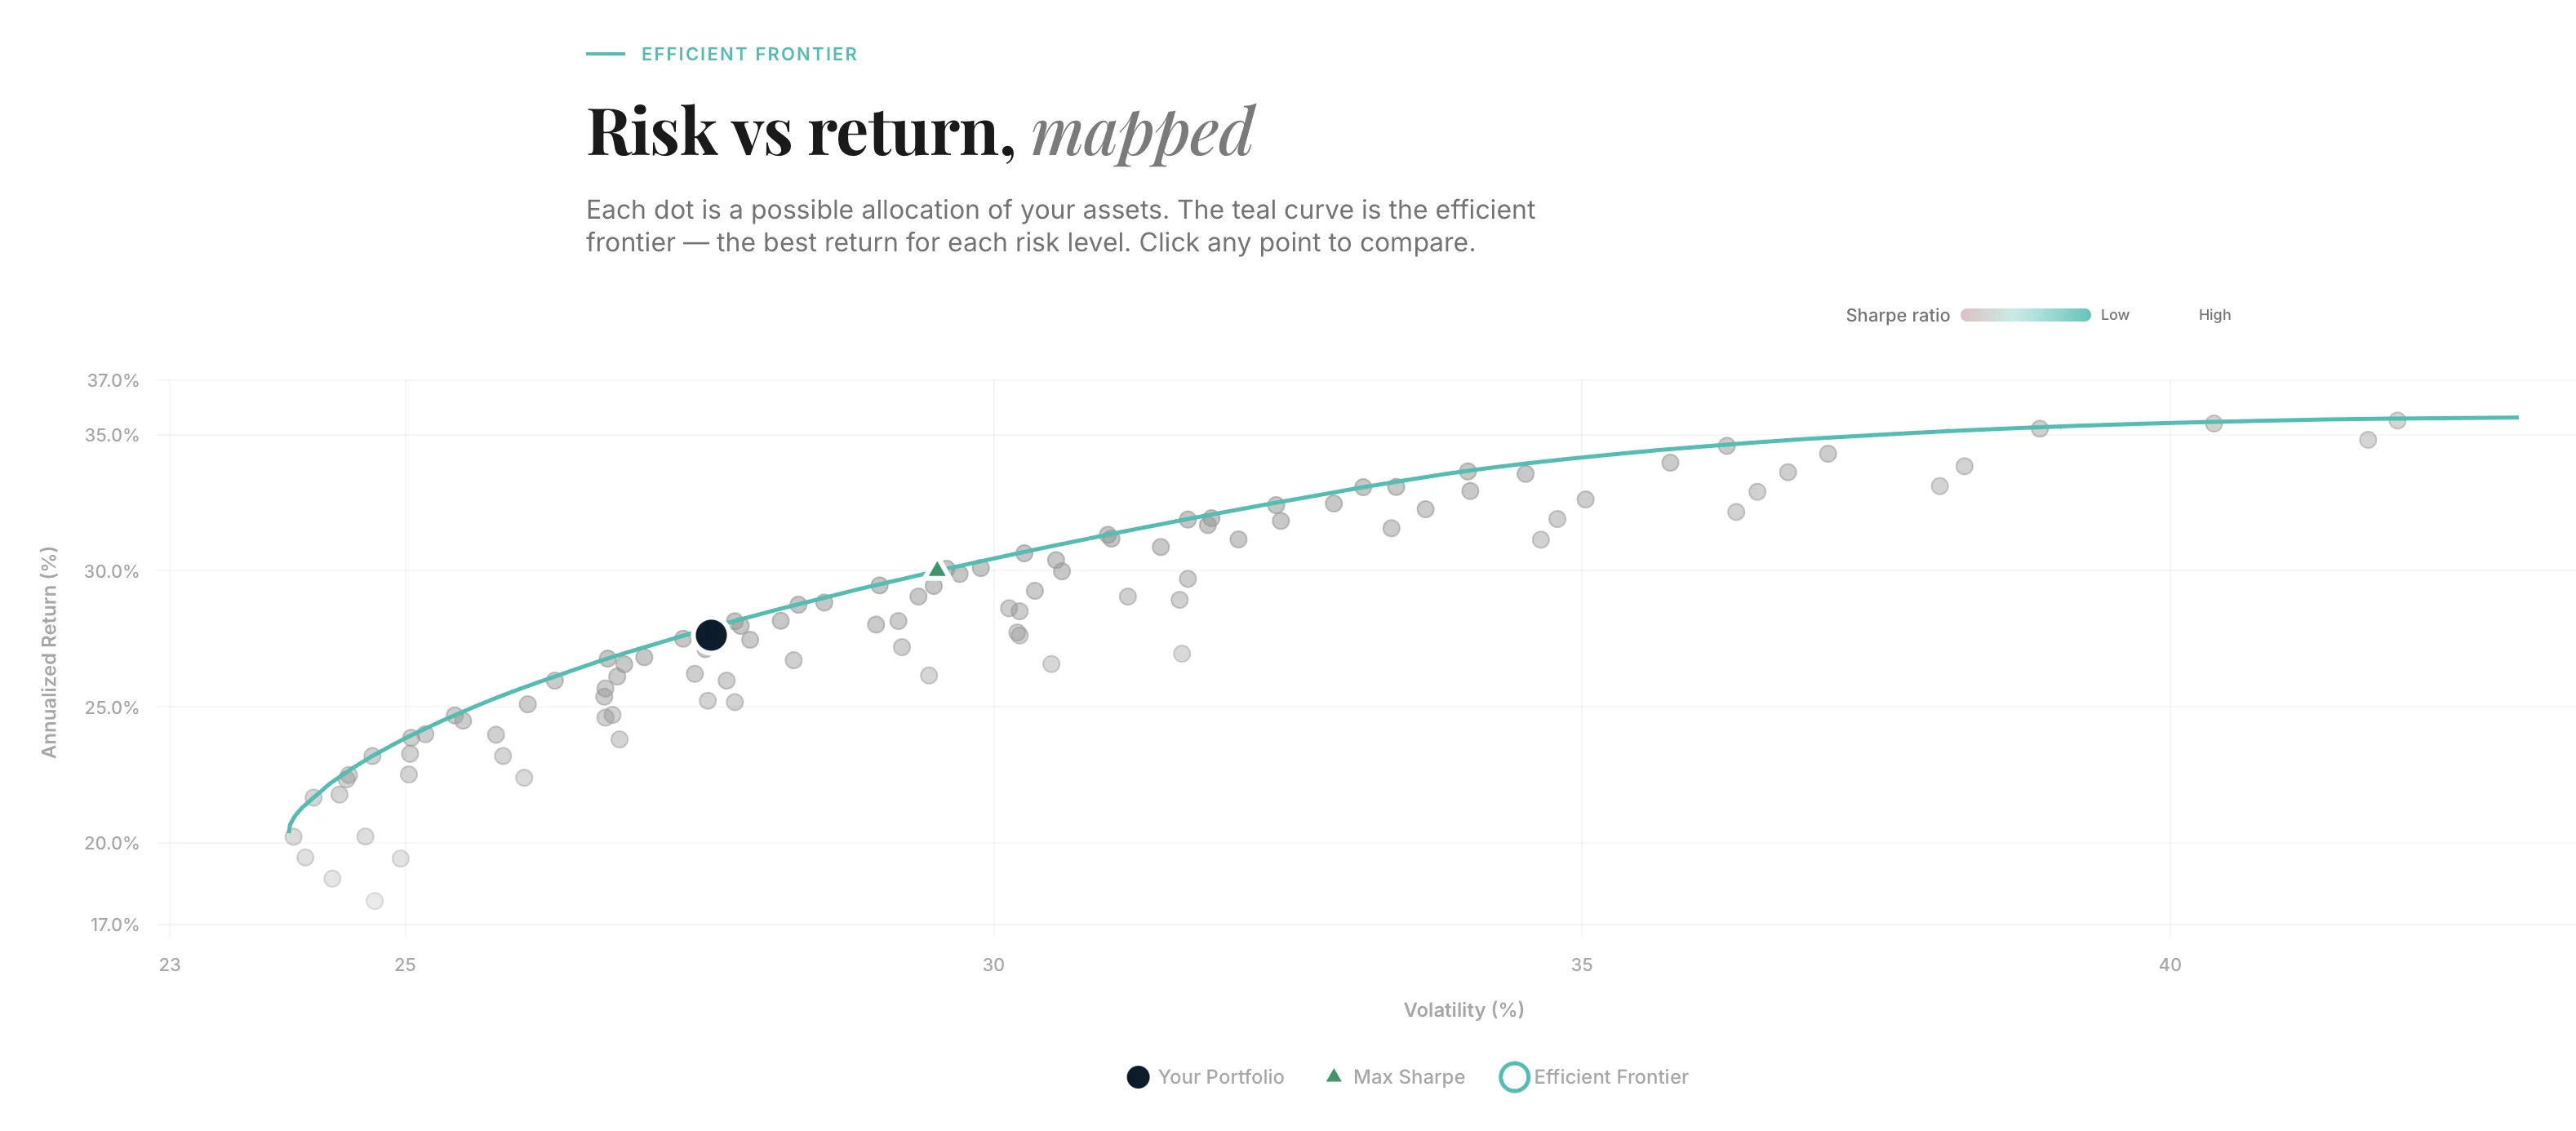
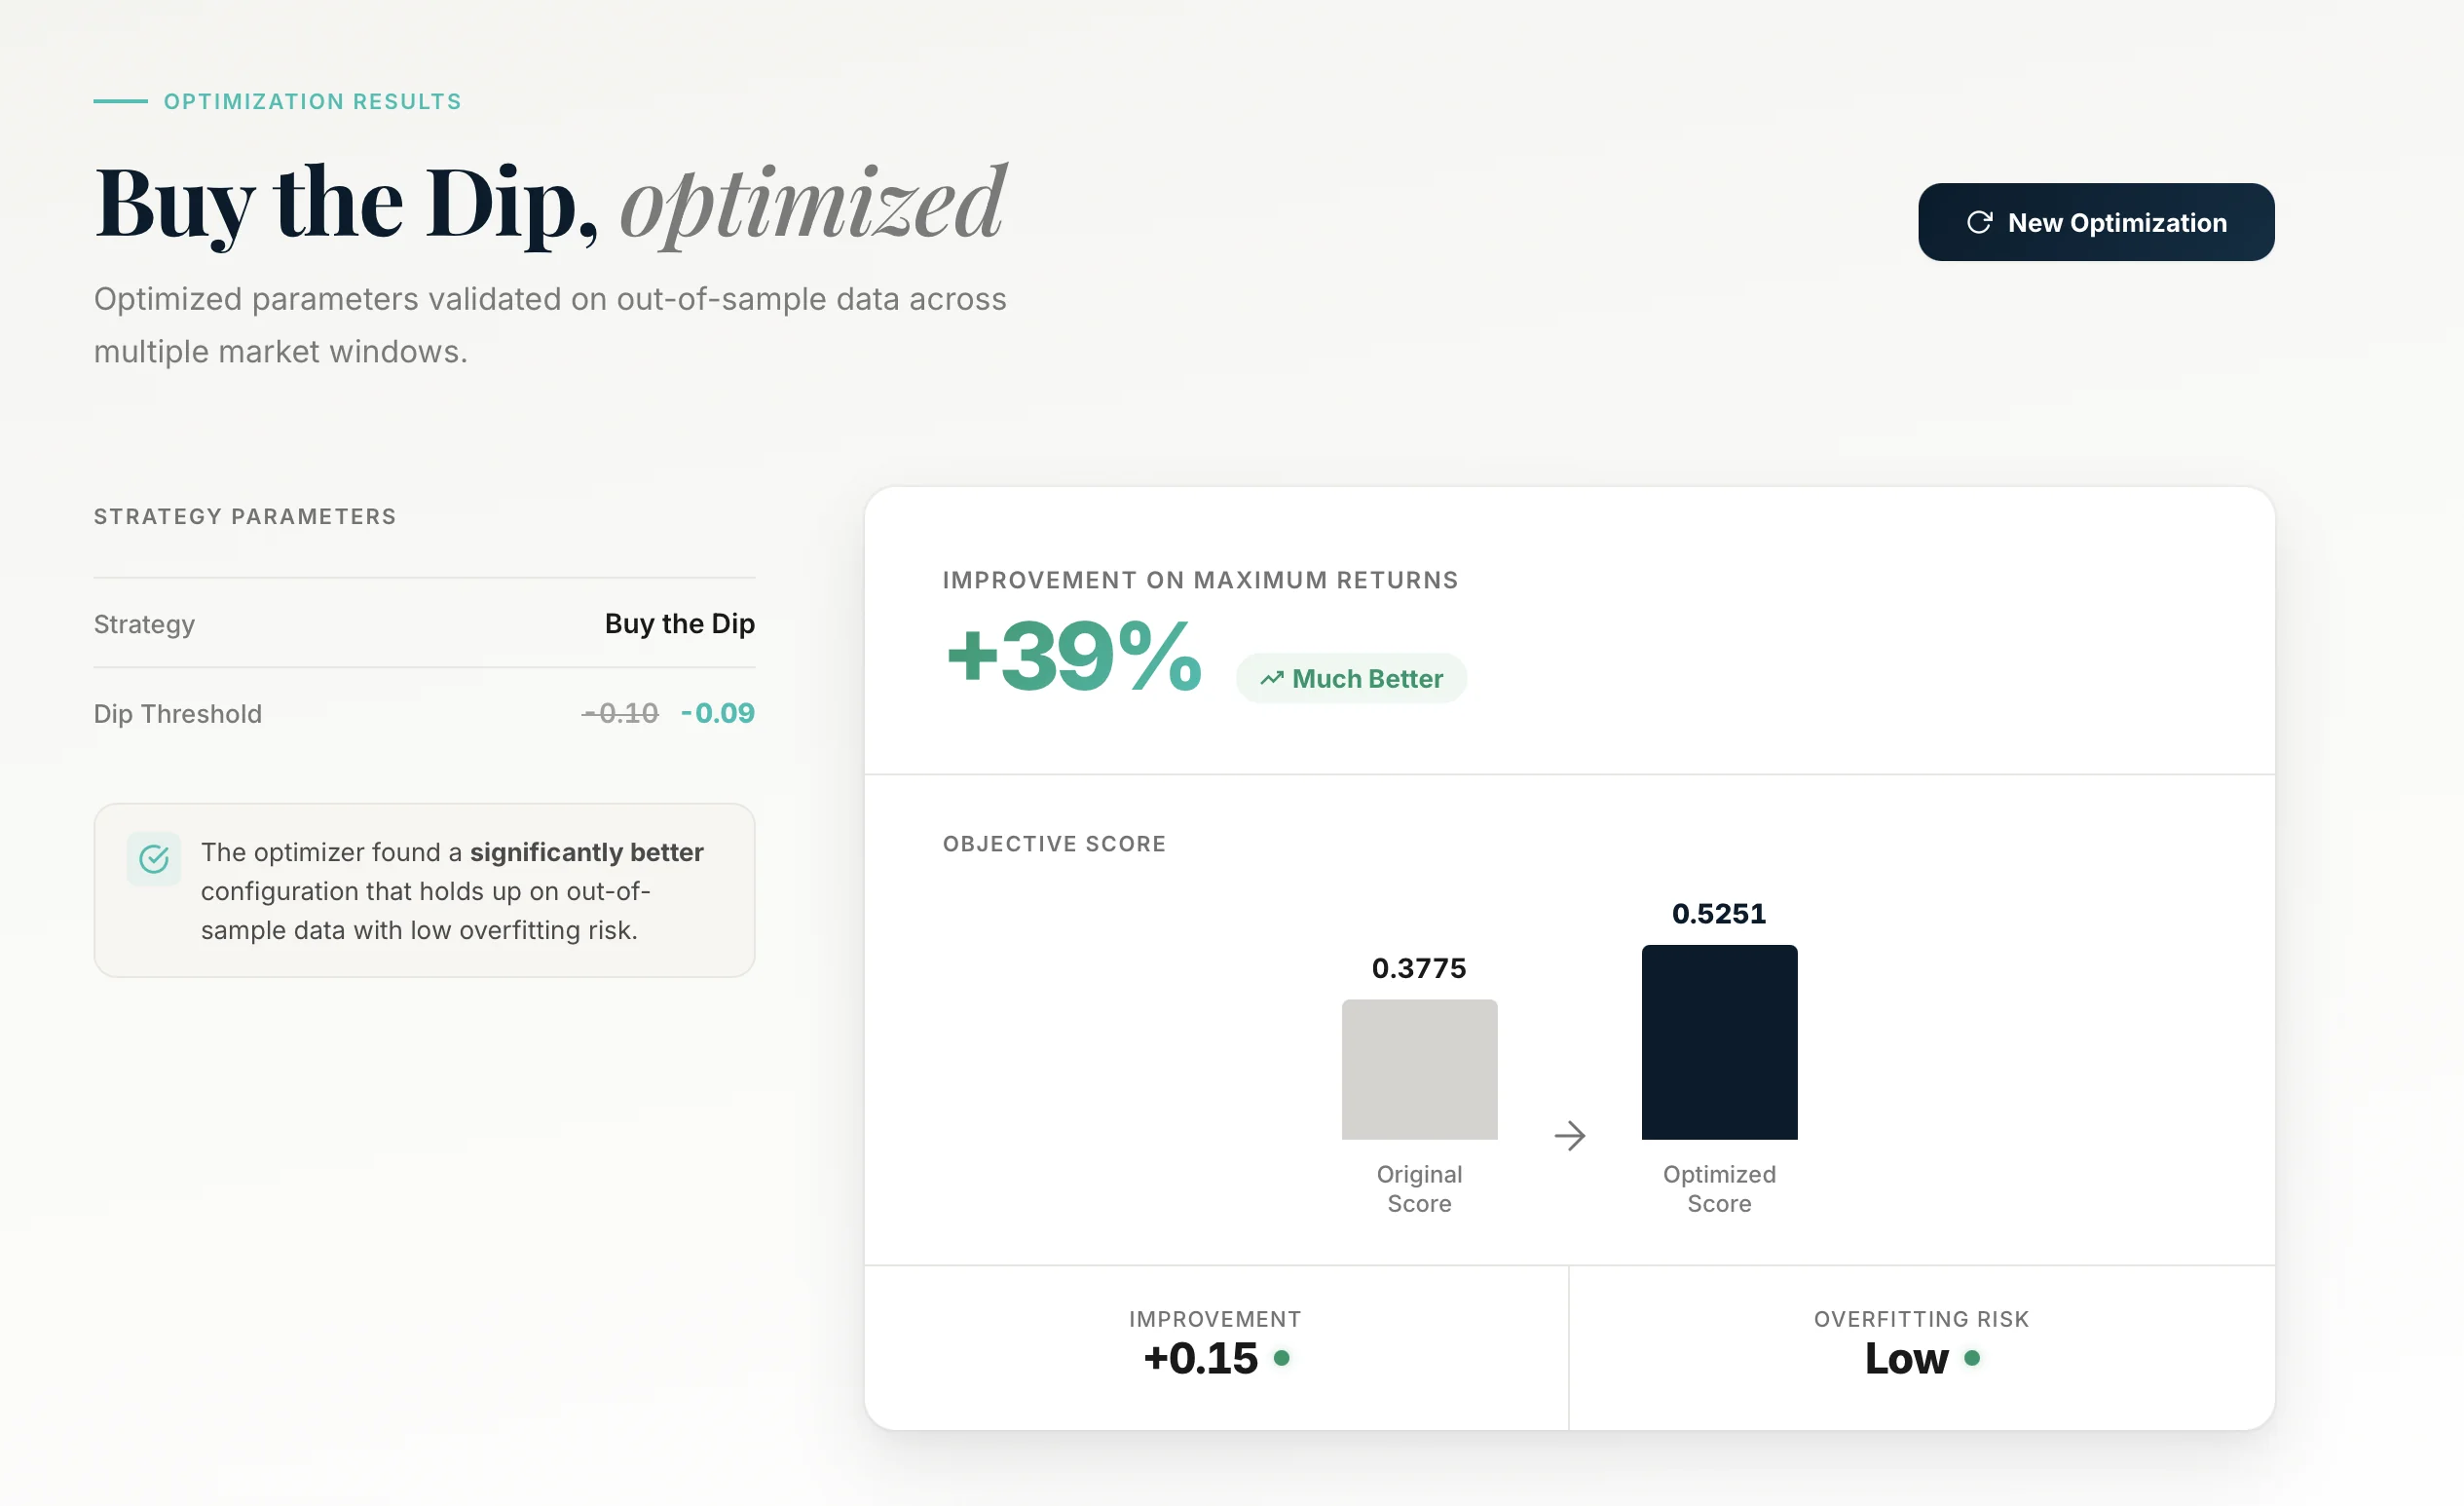
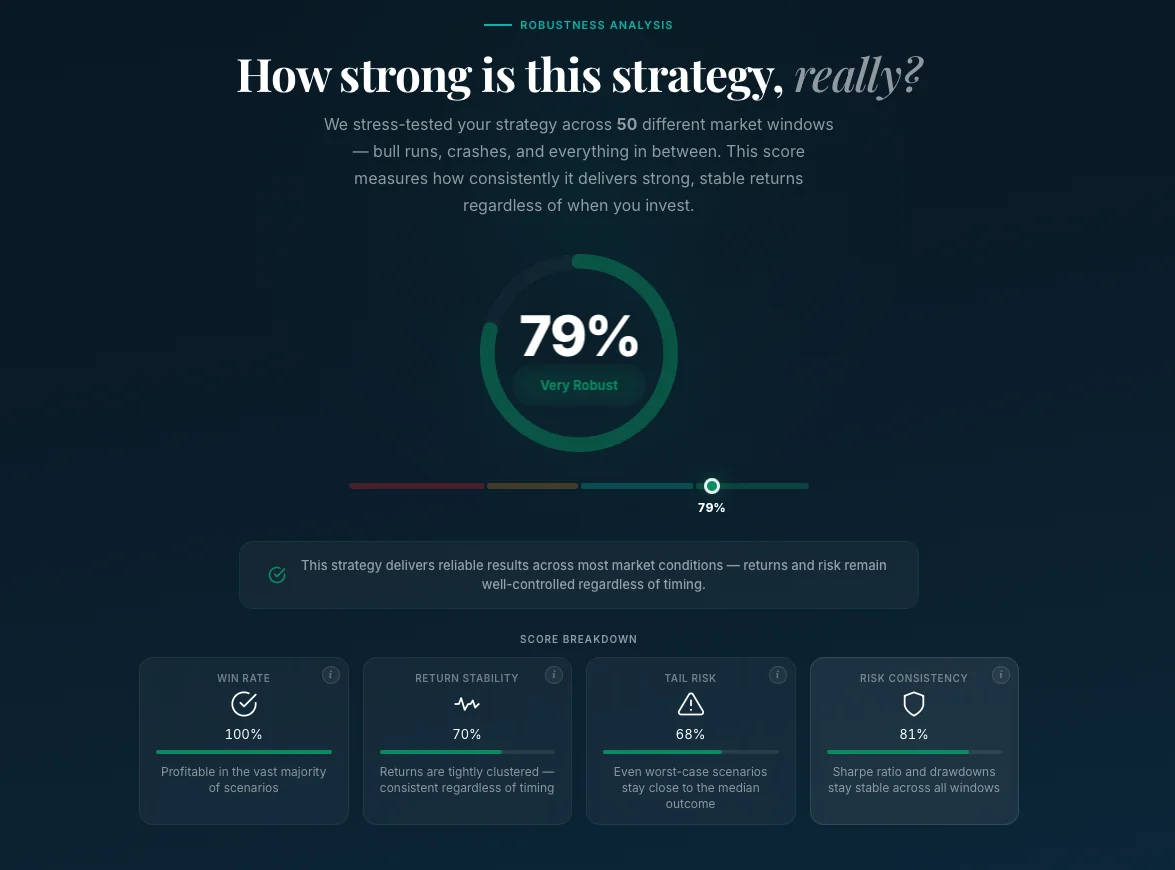
Backtest any investment strategy against historical data. Stress-tested across 50 rolling market windows — so you know if your edge is real, or just luck.
No credit card required · Free tier available
Most investors build a portfolio and hope for the best. They never test it against real historical data. They don't know what to expect — until it's too late.
No coding required. No spreadsheets. Just define your strategy and get a complete analysis.
Every section of the report answers a key question about your strategy. Here's what you get.
See exactly how your strategy performed: total profit, growth trajectory, and key risk metrics — all in one view. Know at a glance whether your portfolio grew or bled.
Median metrics across 50 rolling windows give you the debiased picture. See where your window sits relative to the best and worst outcomes — and know if your results are typical or an outlier.
How does your strategy really compare to the market? Not on one time window — on all 50. For each key metric, see the full distribution of your strategy side by side with the benchmark. No cherry-picked numbers, just the complete picture.
Is your portfolio sitting on the efficient frontier? We test hundreds of portfolio combinations and show you where your allocation stands — and how to improve it for the same risk or same return.
Don't guess which parameters work best. Our optimizer tests hundreds of combinations across rolling windows and suggests the setup that maximizes your chosen objective — Sortino, Omega, Calmar, T-Statistic, or raw returns. Validated on held-out data to prevent overfitting.
A strategy that returns +37% from 2020–2025 might lose money in most other periods. Our robustness engine tests your strategy across 50 rolling time windows to reveal its true performance — not just one lucky outcome.
Start free. Upgrade when you need the full picture.
No. SigmaGrid is a fully visual tool — no coding, no spreadsheets, no formulas. Just pick a strategy, select your assets, set your parameters, and hit run. You get a complete report in minutes.
Instead of testing your strategy on just one time period, we run it on 50 different rolling time windows of the same length. This reveals whether your results are due to genuine strategy quality or just timing luck. You get a robustness score from 0–100.
No. SigmaGrid is an analytical tool. Past performance does not guarantee future results. We provide data and analysis to help you gain insight about your decision's potential impacts, but always consult a qualified financial advisor.
Yes, you can cancel anytime from your account settings. No commitment, no hidden fees. Your access continues until the end of your billing period.
You can backtest any stock, ETF, index, or cryptocurrency available on major exchanges — thousands of instruments. Just search for a ticker and we fetch the data automatically. Historical data goes back 20+ years with split-adjusted prices.
Validate your strategy with data — not hope. Start for free, upgrade when you're ready.
Get Started Free or try the live demo — no signup needed